

Boston Marathon Bombings, April 15, 2013 Lushan Earthquake, April 20, 2013
(Credit: AFP/Getty Images, National Geographic)
A Critical Geography of the News Coverage of the Boston Marathon Bombings
By Catherine D’Ignazio and Luisa Beck
News coverage of tragic events often distills the unequal geographic distribution of media attention. On April 15th, 2013, international attention shifted to Boston, where two bombs exploded at the finish line of the Boston Marathon, killing three people and injuring more than 260. On the same day, a wave of bomb blasts across Iraq killed 42 people. And in the same week, explosions at a fertilizer plant in Texas killed 14 and injured 160. A 7.0 magnitude earthquake left almost 200 dead in Sichuan province, China. The following week, 80 dead bodies were found in Damascus, Syria, after days of intense fighting.
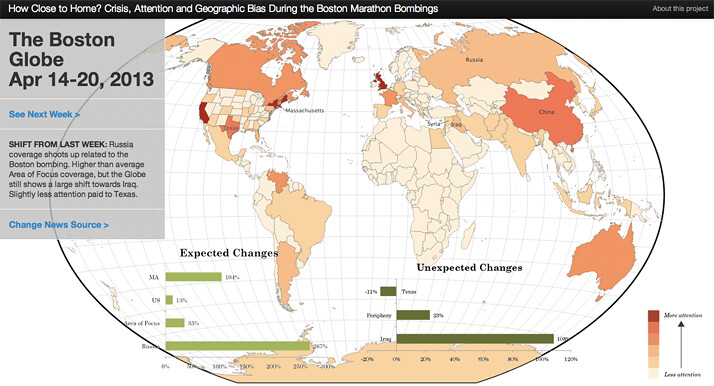
While major news outlets did cover these events, it was not with the same intensity as the bombs and manhunt in Boston. The bombings at the marathon not only led to a drastic increase in coverage of Boston, but also turned the world’s attention to places that were connected to the events: the Caucasus region of Russia, where Dzhokhar and Tamerlan Tsarnaev had ties, and China, where Lu Lingzi, a 23-year old victim of the bombings was from.
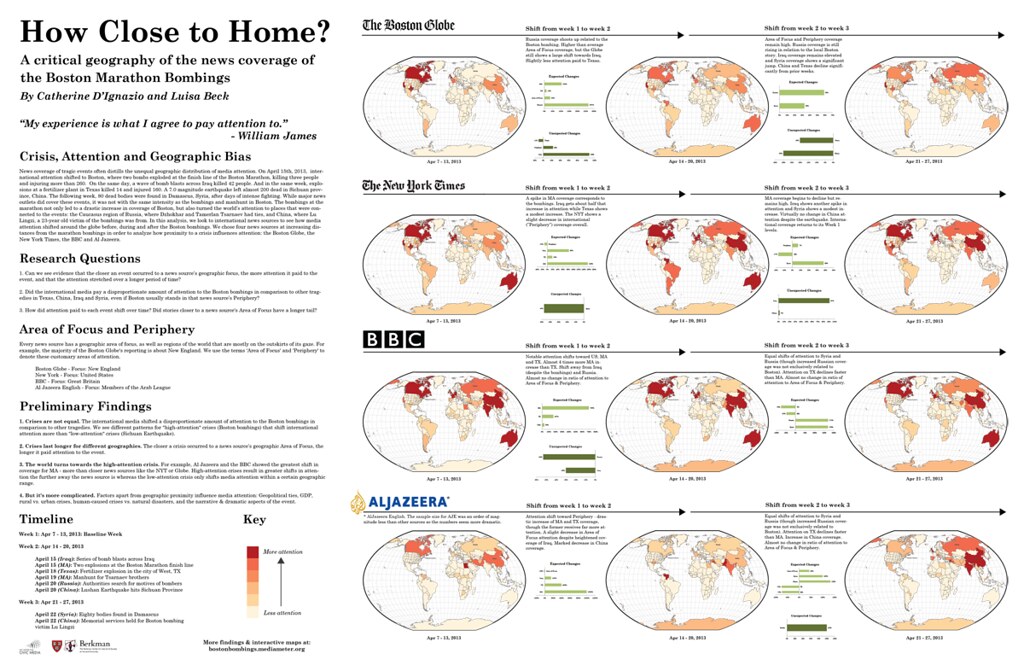
In this analysis, we look to international news sources to see how media attention shifted around the globe before, during and after the Boston bombings. We chose four news sources at increasing distances from the marathon bombings in order to analyze how proximity to a crisis influences attention: the Boston Globe, the New York Times, the BBC and Al Jazeera.
How Close to Home? Interactive Web Version
Research Questions
-
Can we see evidence that the closer an event occurred to a news source’s geographic focus, the more attention it paid to the event? And did that attention stretch over a longer period of time?
-
Did the international media pay a disproportionate amount of attention to the Boston bombings in comparison to other tragedies in Texas, Iraq and Syria, even if Boston usually stands in that news source’s periphery?
-
How did attention paid to each of these events shift over time? Did stories closer to a news source’s focus have a longer tail?
Definition of Terms
Area of Focus / Periphery: Every news source has a geographic area of focus, as well as regions of the world that are mostly on the outskirts of its gaze. For example, the majority of the Boston Globe’s reporting is about New England. We use the terms ‘focus’ and ‘periphery’ to denote these customary areas of attention.
|
News Source |
Area of Focus |
|
Boston Globe |
New England |
|
New York Times |
United States |
|
BBC |
Great Britain |
|
Al Jazeera English |
Members of the Arab League |
Expected/Unexpected: ‘Expected’ denotes the outcomes that we anticipated, based on our own intuitive understanding of the selected news sources and how they operate in the news ecosystem. ‘Unexpected’ refers to attention shift percentages that fall outside of these ‘expected’ trends.
High-attention crisis vs Low-attention crisis: What we characterize as high- versus low-attention crises denote the shift in media attention to that particular geography, not the overall quantity of reporting. For example, the events in Massachusetts and Texas both follow the pattern of a high attention crisis in that they shift international media attention towards them. The sources furthest away from the events – the BBC and Al Jazeera English – show the greatest shifts in attention. However, the overall amount of coverage for the Texas explosion was much lower than for the Boston bombings. The Lusan earthquake in China follows the pattern of a low-attention crisis because the notable shifts in media attention were from news sources more proximate to the event while far away sources like the New York Times and the Boston Globe either showed no shift or actually decreased their China coverage.
Methodology
Inputs: We used the MediaCloud API to retrieve a data set of about 20,000 news articles.
-
Four news sources at progressively further geographic distances from the events in Boston: the Boston Globe, the New York Times, the BBC, and Al Jazeera English.
-
Three weeks of news coverage – the week before the Boston bombings (April 7-13th), the week of the event (April 14th – 20th), and the week following (April 21st – 27th). We used the first week as our “baseline” to show what kind of geographic coverage each news source “normally” engaged in (though we address below how a more robust study would use a longer timeframe of data to develop its baseline).
Processing: Over the last several months we have been conducting research into geographic parsers that are capable of extracting geographic entities from unstructured text. The results of this study will be a separate blog post to come in the next couple weeks. Our results from this work showed that using CLAVIN as a base geoparser along with some custom algorithm development was able to yield up to 90% correct placement of news articles at the country level. We ran each news article through this system to determine the country and/or US state that article was most “about” and then, for each week, compiled a list of article numbers by geography.
How Close to Home? Poster PDF Version (28MB download)
Analysis
Our analysis focuses primarily on the shifts in media attention from week to week and only secondarily on the overall quantity of news stories. From these week by week numbers, we were able to calculate the shifts in media attention for the specific geographies we were interested in: MA, TX, Iraq, Syria, Russia, and China. These places were either related to the Boston bombings (MA, Russia, China) and/or were places where other tragic events had occurred during the same time period.
During the analysis, we devised the various categories defined above that helped us track media shifts: geographic Area of Focus/Periphery for each news source, expected vs. unexpected outcomes on a weekly basis, and high- vs low-attention crises. We looked for spatial patterns in the data based on geographic proximity.
Findings
1. Crises are not equal. The international media shifted a disproportionate amount of attention to the Boston bombings in comparison to other tragedies. We see different patterns for “high-attention” crises (Boston bombings) that shift international attention more than “low-attention” crises (Sichuan Earthquake).
2. Crises last longer for different geographies. The closer a crisis occurred to a news source’s geographic Area of Focus, the longer it paid attention to the event.
3. The world turns towards the high-attention crisis. For example, Al Jazeera and the BBC showed the greatest shift in coverage for MA – more than closer news sources like the NYT or Globe. High-attention crises result in greater shifts in attention the further away the news source is whereas the low-attention crisis only shifts media attention within a certain geographic range.
4. But it’s more complicated. Factors apart from geographic proximity influence media attention: Geopolitical ties, GDP, rural vs. urban crises, human-caused crises vs. natural disasters, and the narrative & dramatic aspects of the event.
Caveats & Open Questions – “But it’s more complicated than that”
-
No single factor explains news sources’ attention to a particular event or region of the globe. Communication scholars studying news values have found evidence that the media deems an event “newsworthy” based on a wide range of factors that include geographic proximity, country GDP, number of troops in a foreign country, story narrative structure and political interests, among many others (see also Galtung, 1965; Jones, Van Aelst, & Vliegenthart, 2011). In our project, heat maps allowed us to visualize attention and begin to hypothesize about the role that geographical proximity plays in channeling attention. But we realized quickly that “proximity” can mean different things. During the week of the Boston Marathon bombings, stories about Russia were, in a sense, local. They weren’t really about Russia, but a continuation of the Boston coverage that now turned to Chechnya and Dagestan to understand the Tsarnaev’s brothers’ motives. Our maps don’t account for this kind of “local” coverage.
-
We also didn’t select articles for topics, but looked at place mentions, which means that articles about a country or state could be about a topic unrelated to one of the six selected events.
-
A lack of attention shift can be deceptive. For example, we didn’t see a shift in China coverage for the New York Times between the second and third week. But that doesn’t mean that the New York Times didn’t cover the story. Rather, it replaced its “usual” China coverage (stories about the economy, environment, etc.) with earthquake coverage, and therefore we didn’t see an article count shift.
-
The sample size of our data for Al Jazeera English was an order of magnitude less than for other sources (150 per week versus approximately 2000 for other sources). Because of this, it’s difficult to draw conclusions about that particular news source. To verify our conclusions, we would need to incorporate a larger data set.
-
The same holds true for our baseline week. In our next steps, we want to expand our baseline data to encompass a longer timeframe so that we can establish a more comprehensive picture of how news sources “regularly” cover the globe.
-
We selected our ‘Area of Focus’ and ‘Periphery’ based on our intuitive understanding of the geographic areas that the selected news sources focus on. But it’s debatable whether the NYT is “international” or “international with a US focus” or whether the BBC is focused on the British Commonwealth or the UK, etc.
Links
- An interactive web version of the project, including all of the maps, graphs and descriptions can be found at: http://bostonbombings.mediameter.org/
- You can also download a PDF poster version of the project (28 MB download)
- Also check out our preliminary Map Handbook for Journalists