
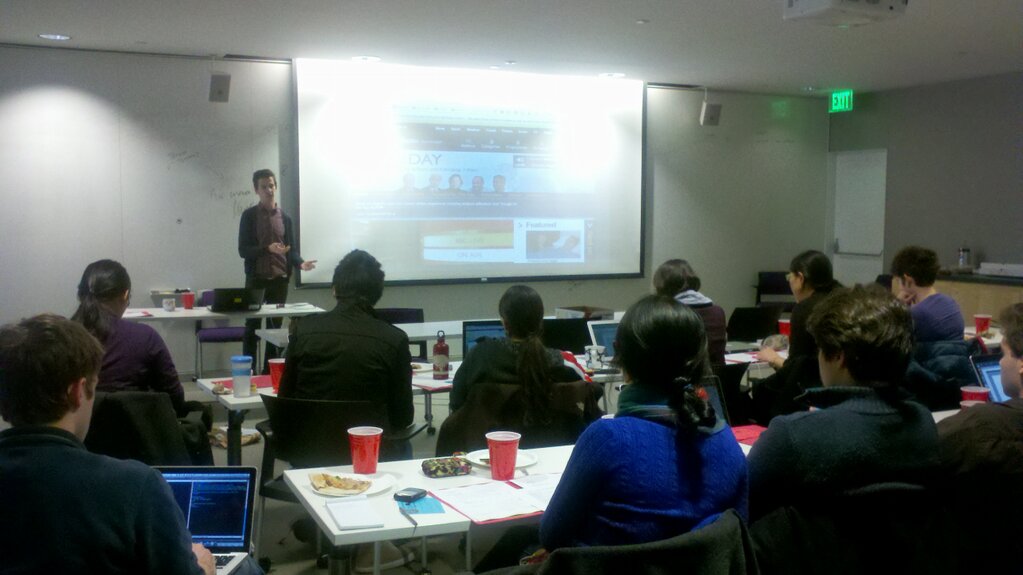
The Tech Data Journalism Bootcamp was developed in collaboration with the Center for Civic Media. We invited speakers from Civic and The Boston Globe to create active seminars teaching journalists from The Tech the basics of how to find, analyze, and present a data piece. A hands-on workshop followed the seminars so students could work with real data—data from the pressure survey. Thanks to Joanna and Chris for organizing the event, to all the speakers for their time, and to David, Joanna, and Kiran for helping liveblog and take photos!
Session 1: Getting and cleaning your data
The first presenters of the day are Matt Carroll and Brian Mooney, self-described “grizzled veterans” from the Boston Globe. Matt is the databases guy, and Brian is the English major. Matt recalls his frustrating experiences visiting journalism classes to talk about databases—out of 20 sets of eyes, 18 will glaze over instantly at the first mention of data and he’ll spend the rest of the class lecturing to the other two. He’s hoping that the ratio might be a bit better here at MIT. Publicly available data, Matt says, is only the tip of the iceberg. In this session, he’ll introduce us to proven methods of finding, obtaining, and cleaning data.
Oftentimes, publicly available data will only be a sliver of the full database—normally restricted to researchers and requiring FOIA requests to access. This can be a difficult, drawn-out process. Matt shows us a number of interactive graphics:
Incomes snapshot across MA: http://www.boston.com/yourtown/specials/snapshot/massachusetts_snapshot_per_capita_income_2007_2010/

Nursing homes: http://www.bostonglobe.com/lifestyle/health-wellness/2012/04/28/database/j8FWvjNHMaP6uo7hQ0mrHO/story.html
Drunk drivers: http://www.bostonglobe.com/metro/2011/10/29/for-drunk-drivers-habit-judicial-leniency/D7eox8ius6dwevTbHXwOUO/story.html
Data is commonly incomplete or inconsistent across sources. It took months to clean the data needed for the drunk driver graphic.
Matt now pulls up an article about car towing patterns in Boston. The reporter for the story had no experience with databases, but decided that he had the means of obtaining relevant data. Together with quotes obtained from stakeouts, the data came together in a map of car towing hotspots, indicating where and why we get towed, and who does the towing.
Towing map: http://www.boston.com/news/local/massachusetts/graphics/towing_map/
“The story is whatever you think it is,” says Brian. “It’s all amorphous. You have to go out and find the material that makes it compelling, that makes people want to read or watch it.” He sees data journalism as a process of “making news”—and there’s often no way of predicting its eventual impact. While he doesn’t consider himself a data journalist, he’s written stories based on statistics.
Brian recalls a story he wrote on Mayor Menino’s record of dealing with race. He thought about running a public opinion poll (for $20,000), but ultimately opted not to—he considers this “paying for a story” or “lazy journalism”. The city of Boston had a history of segregating public housing until the ‘80s. The housing authority kept track of data on race-related incidents resulting from integration. Brian obtained this data. He also collected data on employment and income. Overall, Brian would give Menino a positive rating.
“You could write this story to fit your own pre-conceived notions… that’s a trap that journalists can often fall into.” Instead, Brian chose to stand on the grounds of statistics, and contextualizing that data with anecdotes and quotes. “It’s an impressionist painting. It’s never perfect. It’s not a science.”
He says that your first instinct as a journalist should not be to submit a FOIA request—many people are willing to give you data if you ask for it nicely.
“The data is the beginning, it’s not the end,” says Brian. “It’ll never tell the whole story. That’s where your instincts as a journalist come in.”
We then move on to Q&A.
How do you tell the data is still relevant if it comes from a few years ago?
It’s a subjective question. It depends on the question. This came up recently with person’s income. The most recent data was 2010. But 2010 just wasn’t good enough.
When you ask people for data, how much do you tell them about the angle of the story?
They have to give you the data if you’re dealing with public data. It depends on how sensitive it is. If you’re requesting public records, the law makes no distinction between journalists and ordinary citizens.
What are the strategies for getting data from private entities (like MIT)?
Nonprofit institutions have to publish a large amount of data to the IRS (I-990), etc. There’s crime data available. Or you can just ask. Again, attempt to avoid FOIAs unless the institution requests it specifically. FOIAs are long and a pain in the neck, so just ask nicely.
Are there examples from other student journals where they’ve done really good stories, and whether the information that fed those stories was publicly or privately available?
Look at I-990s or salaries. You can compare MIT to other universities. Look at institutional research money. Some businesses will do contracts with MIT and that gets disclosed. Endowment investment decisions.
Rodrigo Davies, a research assistant with the Center for Civic Media, recalls his experience as a student journalist working on a story about disparity in rent charges between different accommodation blocks. To gather information, they asked different people for different pieces of information (“no single smoking gun”). Since these people were university employees, they had to be careful about protecting their identities.
How much detail in data is too much?
Specifically thinking of the NY local paper that published the names and addresses of all the gun owners in the area post-Sandy Hook. This was publicly available information, but the people whose names were published were still uncomfortable with it.
As a journalist, you’d say this is public information. It’s news, it’s a public record. Whether or not you should publish their names, then you’re putting people in danger for no reason—they haven’t done anything wrong, as far as you know. Just because someone has a legal right to a firearm, not everyone needs to know that.
For example, with sex offenders, people need to know where they are—gun owners aren’t the same.
Session 2: Data cleaning and visualization
The next speaker is Gabriel Florit, who does data visualization at the Boston Globe. Data cleaning is 50% of what they do. He will run us through an example of using Google Refine to clean data, geocoding it, and making some quick and dirty visualizations. Specifically, he pulls up a publicly available database put out by the City of Boston about calls related to winter storm Nemo.
He downloads the data as a .csv (comma-separated value) file and loads it into Google Refine, an open-source tool for working with messy data. Google Refine allows you to adjust a number of settings depending on the input data format (parsing to dates, skipping headers, etc.) At first glance, it looks like Excel, but it’s far more than that.

Gabriel focuses on the “REASON” column, which shows the reasons why calls were made to city authorities. With such a large data set (15,000 items), plotting everything would be unhelpful and would probably crash the computer. Instead, it may be more valuable to focus on a particular category, or facet.
Google Refine offers multiple tools for faceting and aggregating data, as well as filtering. Gabriel zooms in on complaints having to do with trees (a much more manageable data set of 29 items). Most of the time, when you’re dealing with geographic data, you may have an address but rarely have latitude/longitude. Google Refine allows you to geocode this data and generate those values.
There are many ways of doing this, but Gabriel prefers the Data Science Toolkit, a great collection of data-cleaning tools. One tool is a Street Address-to-Coordinates converter, which can generate coordinates from addresses in bulk.
Google Refine allows you to add a column by watching a URL. This is useful for running the contents of one or more columns through a conversion API, such as the address-to-coordinates lookup. He also demonstrates some of the text and column transformation tools. Google Refine allows you to specify templates for what your output will look like, in this case a JSON object.
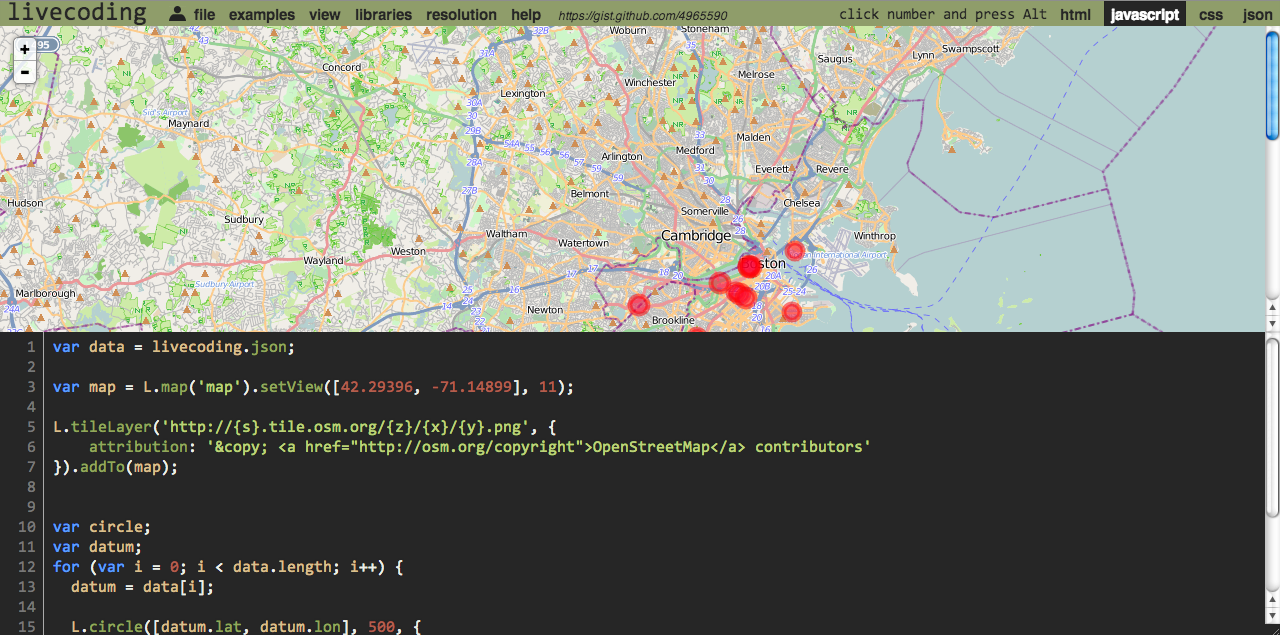
Gabriel then introduces us to livecoding.io (similar to JSFiddle), an online tool he created that allows you to code HTML, CSS, JS, and JSON in-browser and see the changes in realtime. The editor has a number of cool features, such as a built-in color picker, size sliders, easy access to commonly-used JavaScript libraries, and easy snippet export to Github.
Now, Gabriel moves on to Leaflet, an open source JavaScript mapping library. He walks us through a tutorial on how to set up a map and loads in the JSON data of tree-related Nemo complaints from before. The whole process is very streamlined, exemplifying how rapidly a journalist might be able to prototype a quick data visualization. Gabriel also gives a shoutout to Highcharts, a JavaScript library for creating charts.
Session 3: Interviews
The next speaker is Rodrigo Davies, who’s had extensive experience working across print, broadcast, and digital media. The toughest thing about interviews you read in the newspaper is the fact that you don’t know what questions were asked. All you see is the final product: these great quotes and wonderful anecdotes. On the radio, as opposed to TV, you’re more likely to encounter higher-quality interview questions. Rodrigo suggests checking out BBC Radio 4 as a model for how to conduct interviews with depth.
How do we get a good interview? How do we prepare for the interview that we think we’re going to have? It starts with finding the right person. Sometimes there is that one person and you’re stuck with them. Rodrigo encourages us to think about the spokespeople for the stakeholders involved in a story. Ask yourself: Who are all the people who are involved with your project? What is their media experience? Examine their manner and method of expression.
PR people can be a great resource—they know how to summarize key issues succinctly, but they may also provide bland answers to hide “the horrible truth”. Have in your head a map of where your interviewee sits in the picture: who they like, who they don’t like, and adjust your questions accordingly.
You should not only think about how to get the most information possible, but also what information you can use. Knowing a lot about the interviewee is good because you can stroke their ego and thus extract more information. Rodrigo says, “I’m going to trust you to use the dark arts responsibly.”
Another “dark art” is finding out information about your interviewee that is not directly related to your topic. You’re going to end up in a very intense conversation about your topic, so this helps put your interviewee at ease. Talking about rollerskating, say, for 5 minutes during the interview will provide some relief.
You don’t want to give your interviewee too strong an idea of your angle going into a story. You don’t want to prime their responses or make them say something they don’t really mean. That being said, you shouldn’t be completely neutral. Having strong opinions about something will establish rapport.
Next, Rodrigo brings up the technique of social media stalking—find out who their friends are, and their interests and affiliations. Google them. Be subtle about having collected this information, though, as revealing too much may come off as stalkerish. Rodrigo mentions Rapportive (“this is near essential”), a plugin for Gmail that shows you all publicly available social media profiles for any person that you converse with over email.
Next, Rodrigo tells us about Newsle, which notifies you when people in your network or contacts lists appear in the news. One interesting thing about the service is that it picks up coverage from obscure blogs or industry newsletters, which can turn out to be quite useful.
Now that we’ve done some pretty hardcore stalking of our interviewee, what else do we need to think about before going into the interview? One: what kinds of things can this person tell me? Don’t waste time asking for statistics or details (unless the person you’re interviewing is the data person). Often, the most senior person is great for quotes and rhetoric, but terrible for details.
Two: who can this person introduce me to if I need more information? Think about interviewing as a pathway to more people and information.
It’s not all business. Be prepared to talk about other things. Don’t be overly familiar, but do say stuff like “how’s the family?” or some topic unrelated to the story. You want to put the interviewee at ease. The single best way to get good quotes or information out of someone is demonstrating that you know your stuff and want to put out a good story. You have to overcompensate with most people’s dislike of journalists. Make them feel good about being in the situation.
A bullying style works maybe 1 time out of 100. You don’t want to gain the reputation of being the bad cop. You want to be the nice journalist that everyone wants to talk to. Learning shorthand is a waste of time, argues Rodrigo. Tape everything. Handwritten notes and shorthand are great for concealing information later on, but that is one of the only cases that it’s justified. Otherwise, you want to record it—helpful for transcribing later. You don’t want to spend time writing, you want to spend time listening and giving the interviewee your attention. You put the tape on, and forget about the reporting.
Look the person in the face when you’re doing your interview. Think about where you want your questions to be. Be mindful of the impression you’re giving with your material: “do you want to be the kid from MIT with the iPad?” Think about who you’re interviewing, the context of the story, and adjust accordingly. For example, taking an electronic device could be a distraction if you’re interviewing someone over 70.
Minimize surprises. If possible, if you’re interviewing someone in an unfamiliar location, stake it out beforehand. You want to maximize clarity as to when you’re recording and when you’re not. You want to establish trust when it comes to off-the-record comments, and signal this to the interviewee visually.
How do you keep the conversation flowing the way you want it to? Start at the beginning of the story. It’s easier for everyone if the interviewee can tell their story in one coherent chronological flow. Jumping around in time exhausts people.
Vary the framing of questions you ask—change it up, asking some more formal scripted questions in tandem with informal follow-up questions. Keep a mental record of what topic areas you want to cover, and divide time accordingly. Be prepared to completely disregard these, too, if the interviewee says something extraordinary and you find a more interesting story.
Rodrigo’s favorite “dark arts rule” is to check if and when you can follow up with the subject.
Don’t see it as you had this one great moment with a celebrity, and now it’s over. Think of it as the start of a relationship. Interviews set up relationships for stories in the long run. Falsely ending the interview (“I just have one more question”) and continuing with five more questions will relax the interviewee and elicit the most open answers of the interview.
Now we move into Q&A.
Do you pre-interview before you tape audio/video interviews?
You absolutely have to. Rodrigo generally sets up a 15-20 minute conversation about all of the topics beforehand. Brief with an assistant if you have to. The five minute taped interview has to be absolutely brilliant, so this briefing gives the interviewee a chance to think through their answers.
If a source asks to see a story before publication, what is the proper policy regarding the ethics of this?
Depends on the media company: some are incredibly corrupt, while some maintain more integrity. The Tech will never release the story to sources prior to publication, but the policy is to clear all quotes with them to ensure that they weren’t misrepresented.
Don’t leave too much time before you clear quotes, since people will often change their story. If the source wants something incendiary revoked, it’s probably best to do so. It’s often more valuable to maintain a strong relationship with an interviewee than it is to get one great quote. As a freelance journalist, Rodrigo wouldn’t offer to clear quotes, but would do so if explicitly asked.
If the subject doesn’t construct sentences properly (if they stutter, for example) or answer a question in a convoluted way, clearing quotes is a great way to clean up their sentences. Paraphrasing quotes without permission will discredit you as a journalist.
How do you get someone to move off a particular topic?
Mention that your time is limited and you were interested in another topic.
Now we move on to post-interview material.
You’ve got everything on tape; what do you do next? Start transcribing your notes as soon as possible. This gives you the opportunity to clear doubts ASAP. You can also follow up with someone else if you spot gaps in the story. One strategy is to listen back once without transcribing to pick up on minor details or parts that don’t seem consistent.
Try and contact anybody that gets referred to in an interview. Start with an open-ended request to talk, but if they refuse, tell them why: “someone made some claims about you that you might want to respond to.”
Check every fact and statistic that an interviewee gives you, especially if they attribute it to someone else. Getting numbers or quotes wrong is not a story—this happens all the time.
If you can demonstrate an ongoing interest in the issues of the story by putting effort into your research and follow-up, people will respond more seriously and provide more information.
At MIT, it’s often hard to talk to the people you want to talk to, in part because the school has such a strong press office. How do you get around these press people, hired to put themselves between us [journalist] and them [the desired interviewee]?
Two suggestions: first, become best friends with the press people. They often deal with more high-profile journalists, so align your priorities as much as possible. Put yourself in a situation where asking for favors is comfortable.
Second, frame your interview in terms of something milder that they are willing to talk about. This is a very well-worn technique: ask three obligatory questions about their press event, then follow up with one incendiary question.
What if you’re interviewing someone, but you didn’t have an opportunity to research beforehand (i.e. you didn’t know who you were going to be interviewing)? For example, you might not catch the interviewee’s name.
Publications have very different rules. You should talk to your editor about what your rules are, but you should get people’s names as far as possible.
Even if you don’t know exactly who you’re interviewing, you should gain a sense of what kind of people you’re interviewing.
Is there a good method for doing impromptu interviews?
Bring a phone with a recording app or a digital recorder wherever you go. That being said, it is important to let anyone you interview know that you are recording the conversation. Even if you’re off-duty, you probably want to carry around a tape recorder, much like how one might bring a camera everywhere they go. You never know when you’re going to run into a good source.
What if you run into the situation where someone really doesn’t want to be recorded?
You can reassure them by offering to send them a copy of the recording.
Session 4: Putting it all together
The final speaker of the day is Alvin Chang, another member of the data visualization team at the Globe. His job largely consists of talking about technology to journalists, or talking about journalists to technology. He kicks off the session by asking who in the room is actually considering a career in journalism. Only two hands go up. Alvin is not surprised by this. “With an MIT degree, why go into a failing field?”
He starts with the current status of the field. We have data and tools.
Alvin distinguishes between hard data (databases) and soft data (narratives like interviews and court documents.) Data journalism without a narrative becomes soulless (“the average human has one breast and one testicle), and narrative journalism without data is manipulative. He shows us examples of stories that have one but not the other.
Next, Alvin brings up a quote from Abraham Maslow: “If you only have a hammer, you tend to see every problem as a nail.” Alvin shows us some of the Globe’s tools, and what happens when different types of content are shoehorned into them. The moral of the story is to not let your tools dictate your content.
Articulate your goals: what do you want the user to learn/feel/do? He brings up the example of an interactive he made that visualized Patriots matchups, which ultimately gained little traction online. By contrast, he shows us a recently-popular interactive of US gun killings in 2010. Looking at the interactive, you immediately know the answers to those questions. You know what they wanted to achieve with the project.

Every decision you make afterward should advance towards that goal. There is no such thing as a neutral decision.
Now that you know your goal, move onto ideation. Don’t worry about tools yet. In this scenario, constraints can be good: how much time do I have? Who do I have to satisfy? Alvin recalls his work on a story about Bill Clinton’s DNC speech—they were only given 12 hours to produce something. Because of the time constraints, they kept it simple and manageable. Think about constraints first: it doesn’t matter how grand your piece is if it isn’t published in a timely manner.
You should think about ideas in terms of whether or not they allow you to achieve your goals, not in terms of good and bad.
Alvin now shows us Ian Bogost’s Cow Clicker Facebook game, a commentary on the phenomenon of gamification. In the game, you click a cow over and over again. While this may seem idiotic at first glance, it successfully achieves its goals. Don’t just focus on what does or doesn’t work; analyze the mechanism for its success instead.
He examines the Angry Birds game as a case study for his next criteria. Analyze the use case of the interactive, what devices you’re targeting, and who your ideal user is. He then shows us a number of other Globe interactives that were ultimately bogged down by the need to design for cross-device compatibility.
Alvin shows us a quote from digital media scholar Ryan Cordell: “Even 200 years ago, it still wasn’t complex philosophical treatises that were going viral. It was a short little pithy story that taught a lesson.” Looking at the task of visualization, it all boils down to simplifying the data.
The concept of built-in context: with some datasets, people immediately understand the meaning of the data. The visualization of results from the pressure survey, while interesting to those familiar with MIT dorms and majors, was not immediately comprehensible to those outside the community. Alvin contrasts the visualizations he made for Nemo snowfall data—where the meaning is obvious—and the NHL draft—where this wasn’t the case.
How does the data visualization team work with the news team?
The Globe is a legacy institution, where reporters and editors still run the ship—they come to the dataviz team when they need things done. Alvin says they’ve been trying to push the other way, and try to get in earlier on the process and getting people on their side.