Over the last three days of the Mozilla Festival, the team from the MIT Media Lab & Center for Civic Media has been asking people to visualise their media diets. This is part of a larger project we’re doing with our director Ethan Zuckerman to develop a nutritional label for the news. You can read more about it in this great post on the Nieman Journalism Lab, “Ethan Zuckerman wants you to eat your (news) vegetables“. Clay Johnson of InfoVegan is also writing a book on the topic, set to be published by O’Reilly in the near future.
During the opening of the Web Science Fair, Matt, Dan, and I handed out whiteboards and asked attendees to write down their media diet. Here is what they drew:
Two days later, on Sunday morning at the Mozilla Festival, we held a design session with around 30 people on the idea of Visualising Your Media Diet. We started by introducing our names, roles, and preferred overlord of the future. When not fighting robot aliens, the attendees ranged widely across video, print, the web, software dev, promotion, research, and design. We split into two groups to take on this question. One group talked about the broader philosophical issues at play. The second group used pen and paper to discuss the details of tracking media consumption. The outcome was inspiring! Working with people at the Mozilla Festival brought us fascinating new insights into how people want to consume media.
Issues & Philosophy
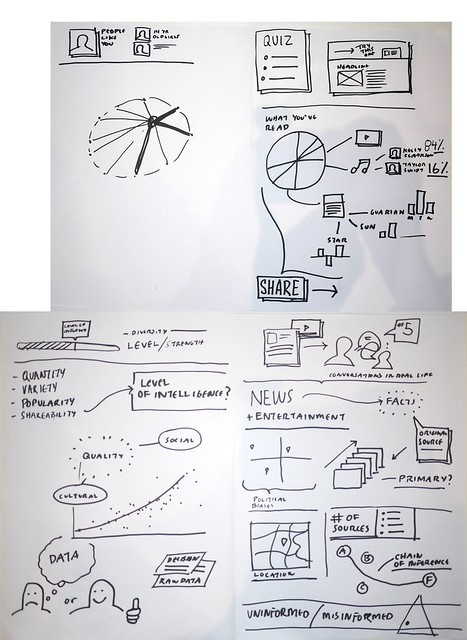
The first group started by talking about which elements of a media diet we would like to measure. Conversation moved into a philosophical debate around how our media consumption shapes what our friends think of us. Facebook’s new “frictionless sharing” has caused many social dilemmas, as all of your friends can now see the individual stories you read in a newspaper. For example, a man in the group said he listens to more Kelly Clarkson than any other artist. Worried about his reputation, he now streams a bunch of Bon Jovi tracks to restore faith in his manhood to his social network. His example shows how peer pressure can shape our media consumption. We can easily imagine that a teenage girl might more eagerly share her Kelly Clarkson listening habits to approving friends. The first group created two clear categories around media consumption: (1) the basic information that we consume, and (2) an additional layer of subjective, peer-driven judgement of what that says about you as a person.
Discussion of peer pressure led the group to wonder if a system that tracks your media diet should share it at all. Reading the news is a very private activity which can betray our interests, passions, and current obsessions. Social network companies are always trying to get us to share these activities, under the (perhaps false) assumption that we are what we consume. There was general agreement that social pressure is a powerful way to change behavior, whereas having basic (private) metrics of our behavior would only influence a small percentage of people (those who are interested enough to track consumption in the first place, perhaps).
Setting aside the social, we also need to consider what it means to be informed. Some people are are informed; others are uninformed. Yet others are mis-informed. After discussing the notion of truth, the first group imagined the value of information on a continuum between raw information and pure entertainment, with witty columnists somewhere in-between. We thought that because these columnists convey information in an enjoyable manner, we are much more likely to read them.
Here’s an illustrated map of the first group’s conversation:
Tracking Your Media Diet
The second group originally planned to talk about metadata, but we quickly realised that methods depend strongly on what we want to achieve. On Friday night, participants had tried to visualise their own, current media consumption, so the Sunday group worked on a slightly different question: how would you *like* to track your media consumption? We seeded this exercise with two graphics illustrating regional diversity, political spectrum, long versus short format, and news categories. We then took around 10 minutes drawing our ideal media diet before sharing and discussing our ideas with the rest of the group.
Many of us loved the idea of tracking our diet to set goals and improve over time. Others were more interested in social discovery: tracking how our media consumption relates to our friends, finding new friends with similar interests, measuring the knowledge diversity within an organisation, or discovering transnational solidarity through common interests. Many of the proposed technologies require the ability to compare different media diets. Many people liked the idea of source mapping their news — either tracking what topics we get from which format, or discovering who funds the media we consume. Differences in literary forms came up, bringing to mind our interest at the Center for Civic Media in “Civic Fictions” and participatory fan cultures. Finally, we were reminded that the dichotomy of consumers and producers no longer applies on the Web. A tool for measuring media consumption should also account for a range of media production from “likes” to blog posts and video uploads.
Our drawings also elicited some fascinating discussion of the broader issues at play. Might a media diet tracker help us map out collective consciousness? Might it become a tool for creating the perfect filter bubble? One of the most powerful ideas was the notion that a media diet tracker might encourage us to reflect regularly on our media consumption, opening us to regular change in our opinions.
Video producers reminded us that media consumption involves minutes as well as words, and that measuring time is as important as processing text. We also discussed ways to measure the efficacy of media in our lives. That led to conversations about the patterns of discovery which are most persuasive. Finally, journalists in the group reminded us that nutritional labels for the news could be powerful tools for media producers, as they make decisions about what to publish.
Here is a list of specific ideas that people in our session proposed:
- What social clusters do my reading overlap with? (Political parties, immigrants, oxbridge educated people?)
- Where do I consume my media?
- What level of interactivity is in the media I consume?
- How much of my media is fixed (articles) and how much is evolving (liveblog)?
- Where is my news being produced? (location of journalists, geotagged tweets)
- How much time was put into producing the media I consume?
- How has my attention to topics changed from week to week or month to month?
- What is my attention span?
- How informed am I about particular topics of interest?
- How does my reading on a long-term trend (crime reports) relate to the overal trend itself (crime trends in a region)?
- Could I map my reading on a political spectrum?
- How much disagreement is in my media diet?
- Categorising media sources
- Time spent consuming news versus producing it
- Tracking ownership (How much came from Murdoch?)
- Serendipity suggestions
- Setting and tracking goals
- Can I track how I jump between media types, across consuming and producing?
- How can we learn about timely topics we haven’t read about?
Where do we go from here?
The Media RDI project is a current, active research project under Ethan Zuckerman here at the Center for Civic Media. At the moment, we’re assessing the validity of our approach and assembling the basic technologies for tracking news diets. At some point in the new year, we will be looking to collaborate with developers, researchers, and media partners to take our initial prototypes into a mature technology that anyone can use.
If you want to follow this project, contact Matt Stempeck at stempeck@media.mit.edu . The project team is Ethan Zuckerman, Matt Stempeck, Rahul Bhargava, Dan Schultz, and me, as well as the MediaCloud team at Harvard’s Berkman Center. We are thinking about starting a mailing list for the project; the more people who contact us, the sooner we can get the conversation started!


