My first sourdough starter was a dud, and I coveted my coworker’s. I had seen crusty masterpieces from Julia on the #bread channel. This was back in 2016, and after Julia enthusiastically shared her starter with me, I began caring for and baking my own boules.
Google News has me figured out and sporadically presents me with breaking sourdough news, including Scientist Says Bread He Baked From 4,500 Year-Old Yeast Is Delicious. I covet. The past few weeks, I’ve received a steady stream of sourdough stories, far different from the trickle I was used to getting. This coincided with my interest in using Media Cloud, a media analysis platform, so I decided to get acquainted with the tooling by diving into a topic of personal interest.
I started by getting a pulse check using Explorer based on US News sources. Is sourdough trending? How does it compare against baking in general? The results follow:
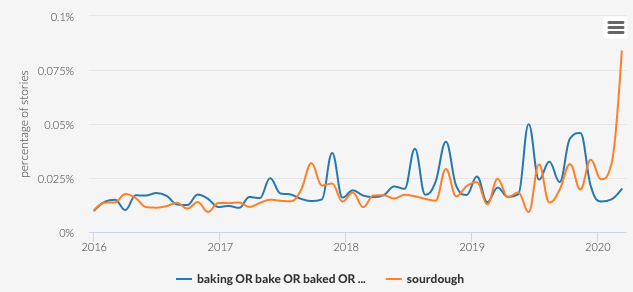
Although these results confirm my hunch, they also raise a few questions: what do the peaks leading up to April indicate? Many of the peaks occur in November and July, where Thanksgiving and Independence Day fall. I intuit that some of these molehills can be attributed to holiday baking projects.
My driving question is: in what way is sourdough spoken about and how has it changed over time? To answer this, I used Topic Mapper to gather and analyze stories related to sourdough. The topic is seeded by the term “sourdough” with articles collected between November 2019 through April 2020.
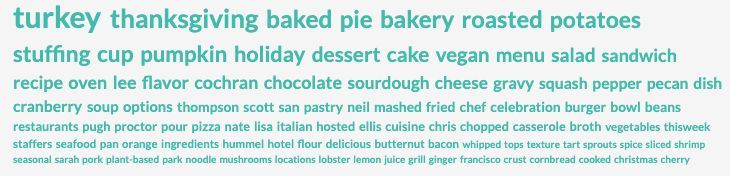
Topic Mapper allowed me to slice the topic into different timespans. Looking at a word cloud for November 2019, I unsurprisingly see many words (e.g. turkey, thanksgiving, stuffing, pie) related to the US Thanksgiving, which takes place at the end of the month. During this month, sourdough is often used as an ingredient in recipes (e.g. sourdough stuffing).
Toggling to different months gave me a sense of how sourdough was used; however, to understand how the topic evolved, I wanted to see the top terms in one view. I download the term frequency data (used to power the word clouds) for each month of my dataset. I then aggregated the 20 most frequently used words per month and created a parallel coordinates visualization, a go-to technique I use to visualize high dimensional datasets.
I’ll briefly describe this technique for those unfamiliar. Each axis corresponds to a month. A term (e.g. stuffing, flour) is represented by a vertical line. Where the line intersects the axis indicates how frequently the word was used in articles collected that month, where high frequency intersects at the top of the axis. Read more at the parallel coordinates wikipedia page.
To illustrate this, let’s visualize the term “sourdough” in this way:
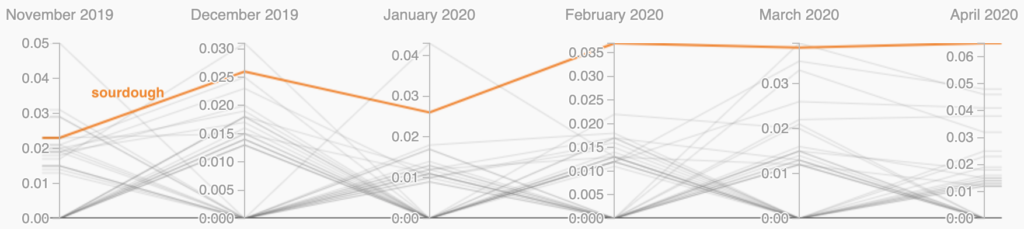
“Sourdough” is frequently mentioned; however, the term isn’t always the most frequently mentioned, and is, in fact, lowest in November 2019. Articles about Thanksgiving dominate during this month, which I’ll illustrate using the visualization to draw out distinct words used during this month by isolating terms used frequently during November. In the following figure, I do this by selecting the lines that intersect at the top of the November axis (they are frequently used) and at the bottom of all other axes (they are not used during these months).
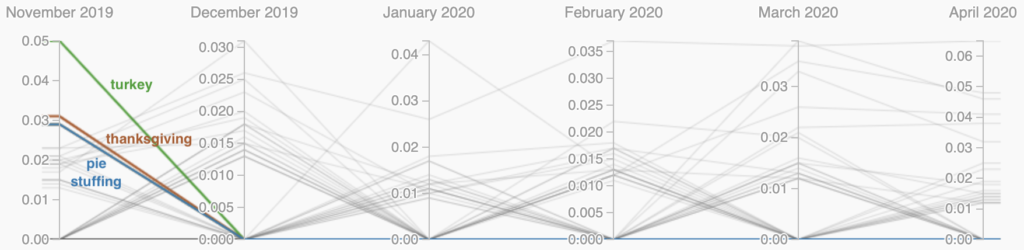
“Turkey,” “stuffing,” “thanksgiving,” and “pie” all evoke images of a traditional Thanksgiving dinner. It’s a heartwarming image in this time of isolation, but more importantly for my investigation, it also gives me confidence in my technique.
Similar to how I isolated words in November, I selected frequently used words in both March and April of 2020 to see the following results:
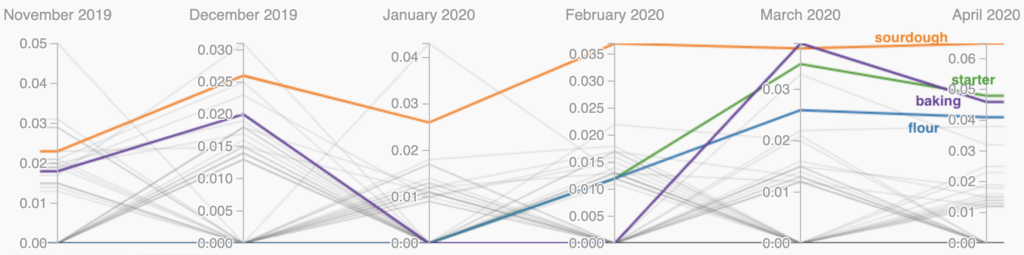
“Sourdough,” “flour,” “baking,” “starter,” and “dough” suggest the stories are about making bread from your own sourdough starter. Why might this be the case? Using Media Cloud, I can view the most shared articles on Facebook. A syndicated article with the title Experts confirm: Baking really is the best way to alleviate stress appears throughout the top listings. Anxiety baking resonates with me. Easy Recipes to Cook While You’re Self-Quarantined suggests there’s no time like social isolation to master sourdough.
This was a really fun exercise for me, and I’d like to conclude with two treats:
- Communal Tins of Sourdough Starter Are Popping Up On Trees in San Francisco on Eater. It’s a delightful little article about sharing sourdough starters. I remain grateful to Julia for sharing her starter, but part of me yearns to tell about finding my “start” in a little jar of goop tied to a tree.
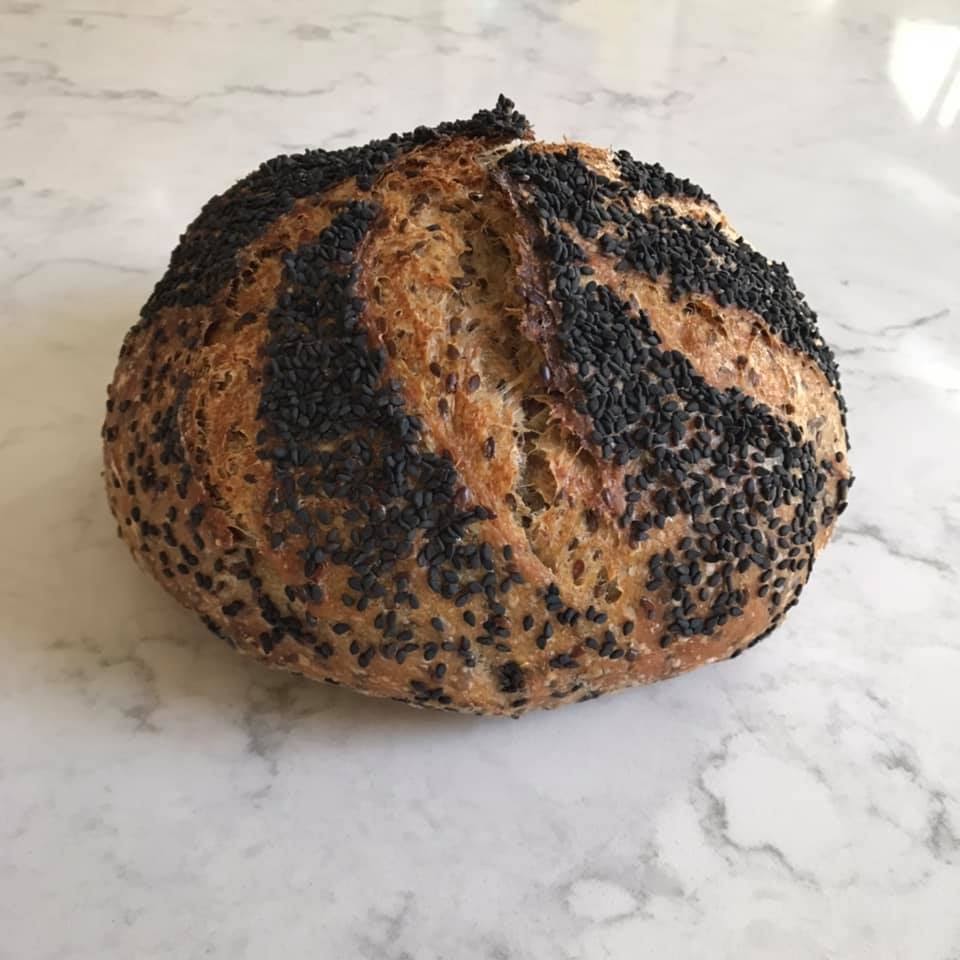
- My latest bake: