MOTIVATIONS
During my first official meeting with my supervisor Ethan Zuckerman, he hands me a Safecast radiation sensor along with a Smart Citizen sensor. The imperative is to explore the integration of sensors into a process of collecting data for civic action. With the price of sensors continuing to drop and the rise of citizen science initiatives, what new civic explorations can be enabled at the intersection of these trends? How can we visualize sensor data in a meaningful way? Over the last two months, I have worked with my colleagues on the Promise Tracker team to explore the integration of sensors into the Promise Tracker platform. After surveying a variety of sensors, we decided to to focus on a low cost sound pressure sensor as a starting point for a Citizen Sensing pilot. The aim of the Citizen Sensing pilot was to 1.) explore one sensor type as basis for understanding the practical considerations of employing sensor data for civic action and 2.) to experiment with visualizing sensor data to inform future work in this space.
WHY SOUND PRESSURE?
We considered environmental sensors that can detect particulates, water quality, and sound pressure for the pilot. To support scalable participation in data gathering, our criteria for choosing the initial sensor focused on price accessibility, measurement accuracy, and consumer availability. Given the low cost and high availability of microphones particularly on smartphones, we chose to focus on sound pressure.
Since noise pollution stemming from traffic and construction is a common backdrop in urban centers that impacts many citizens, we set out to characterize the soundscape of the Boston area to help show both quiet spaces and areas of high levels of sound. To create soundscapes, we needed to capture sound readings along with the locations and times when readings were taken.
PRACTICAL CONSIDERATIONS
Initial Testing
We did a test run of raw recordings from the smartphone microphones of four volunteers. Each volunteer recorded at least one hour of audio from a personal phone placed in its typical location such as a pocket or bag. In reviewing the data, we quickly encountered privacy concerns as we heard snippets of conversations and bio movements. Would participants need to inform those around them that they had a recording device and obtain informed consent? If we recorded anything that would be a security threat, would there be an obligation to report the findings to any authorities?Another major issue was the occlusion of sound when the smartphone microphone was blocked or muzzled.
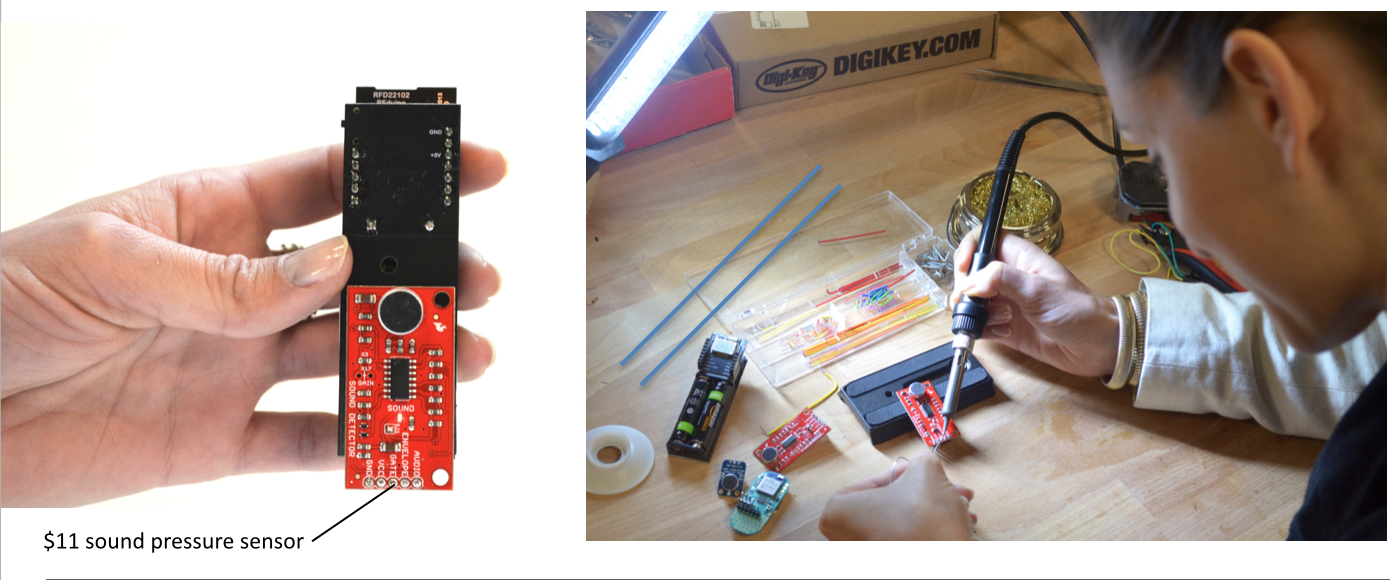
As a result of these concerns, instead of capturing a continuous stream of audio, we decided to capture sound at short intermittent bursts in order to record the average amplitude of sound at a given time interval. To have full control of the sound pressure data being recorded and minimize occlusions, we decided to forgo the smartphone microphone and build a sensor pack. The advantages of a sensor pack included:
-
the ability to distribute the same sound pressure sensor to all participants
-
dedicated battery to power the sensor
-
avoiding interference from typical phone use
- a modular physical interface that could incorporate other sensors not typically available on a phone
Still, having a sensor pack limited the initial level of participation in the pilot.
Selecting Components
At a minimum, each sensor pack needed a sound pressure sensor , a microcontroller, a power supply, and a means to transfer the recorded data. We could add a sim card to the pack and send the data to a server or we could send the data to the phone using bluetooth. We also needed to capture the geolocation of the recorded sound, which could be obtained from a phone wirelessly connected to the sensor pack or could be added to the pack using a gps sensor. The timestamp needed for each recording could be obtained from either the microcontroller on the sensor pack or a connected phone.
Macro Configuration
Since adding gps($40 – $60) , sim card reader($20 -$40), sim card( $10), and data plan significantly increased the cost of the sensor pack, we decided to create a pack that could wirelessly connect with a smartphone which already had gps along with wifi or a data plan to send sensor readings to a server.
Our final sensor pack configuration contained:
-
Bluetooth enabled microcontroller : RFduino
-
Power Supply: RFDuino Battery Shield (2 AA Batteries)
-
Sound Pressure Microphone: Sparkfun Microphone Shield
-
Casing
Integration With Promise Tracker Platform
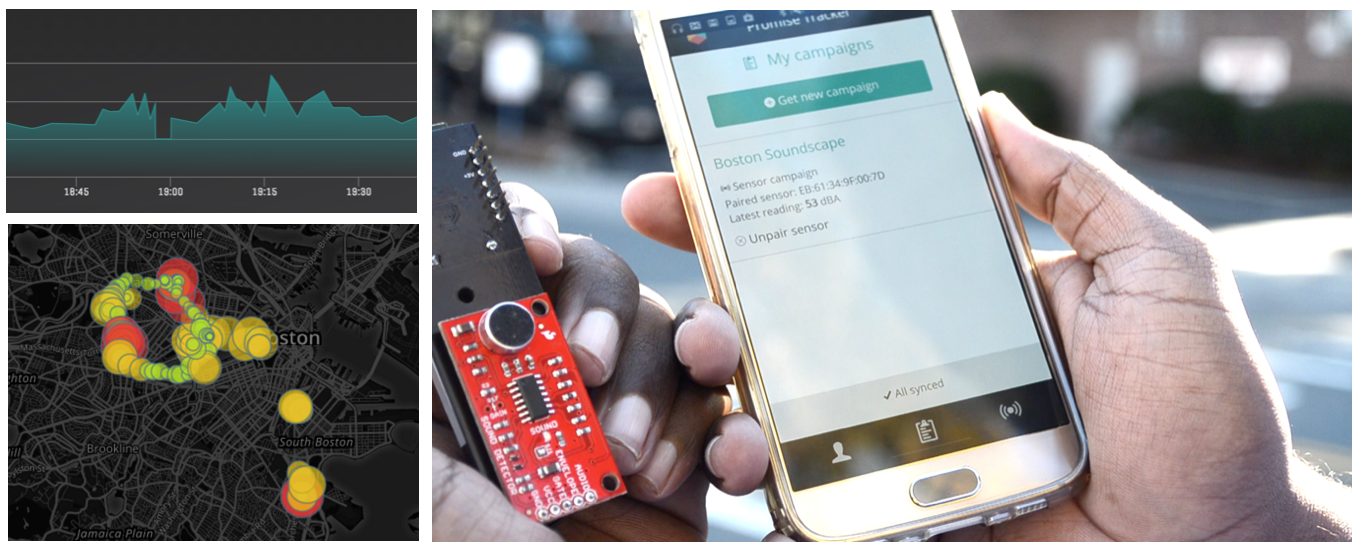
The Promise Tracker platform already provides a robust toolkit for collecting data and visualizing information. To integrate sensor data, my colleague Emilie Reiser modified both the Promise Tracker Survey Builder and the Promise Tracker Mobile application. The Builder now has an option to add a sensor as a data type along with questions that help provide context related to the sensor data if the reading is above a threshold set in the Builder. To contextualize sound pressure, the survey asks for a sound source, an optional photo of the area the sound was recorded, and an optional audio recording.
The mobile application now connects to a bluetooth sensor pack. Once connected, the application continuously sends data to the Promise Tracker platform and notifies the user if a sensor reading crosses a specific threshold. The user can respond to this notification by answering a short survey to contextualize the reading. All of this information is aggregated on the Promise Tracker platform to allow for visualization and analysis.
VISUALIZATION
Exploring how to make sense of data was another important component of this pilot. We soon found a tension between showing sound readings in aggregate to tell a collective story or showing readings from an individual to personify the data. What kinds of visualizations are meaningful to an individual? Do they differ from the types of visualizations that are meaningful to a community? We also questioned the extent to which time and geolocation should be intertwined. Using sound pressure, timestamp, geolocation, and contextual metadata I explored four core map visualizations and a basic chart of noise level overtime.
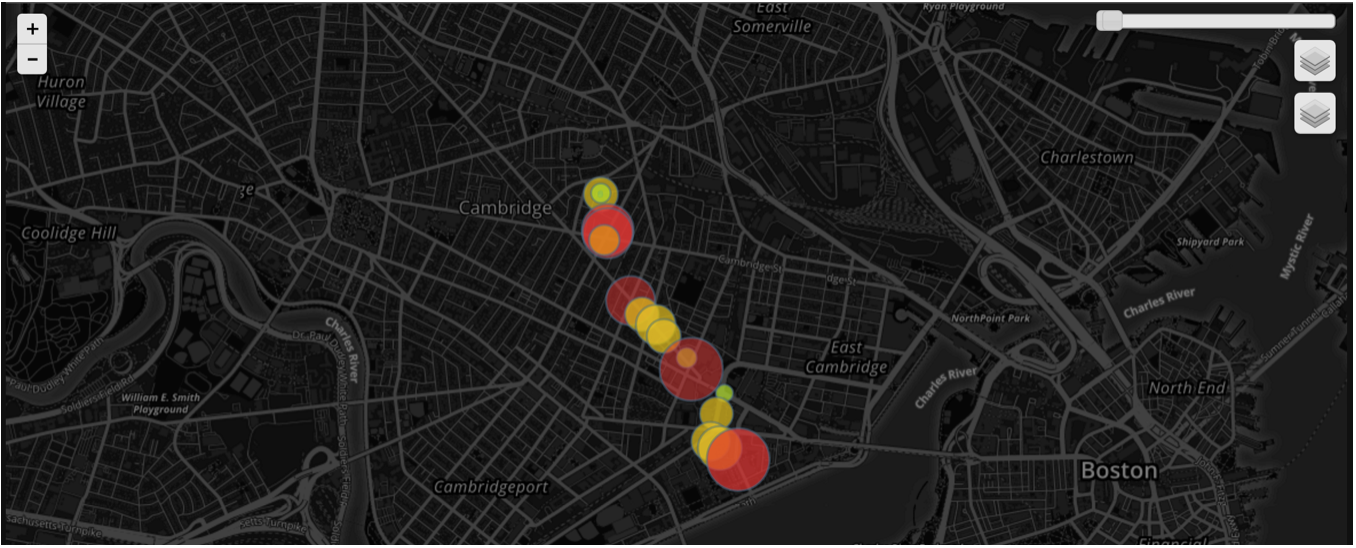
Sound Path
The sound path visualization enables a user to see sound levels during a specific time interval of interest over a given geography. The sound readings are visualized as circles with color and size corresponding to the noise level. Hovering over a circle enables you to read the specific noise level for a reading. By dragging the slider bar on the top right hand side of the map you can select the time interval to view. Below you will see the morning commute of one of our pilot participants.
Annotations
To provide context for readings above a set threshold, annotations can be made visible on the map. These annotations contain an optional photo of the area the sound was recorded, a sound source, and an optional audio recording. Annotations combined with sound paths or soundspaces help to tell a story. Below you can see that the loudest parts of a participant’s commute were near busy intersections.

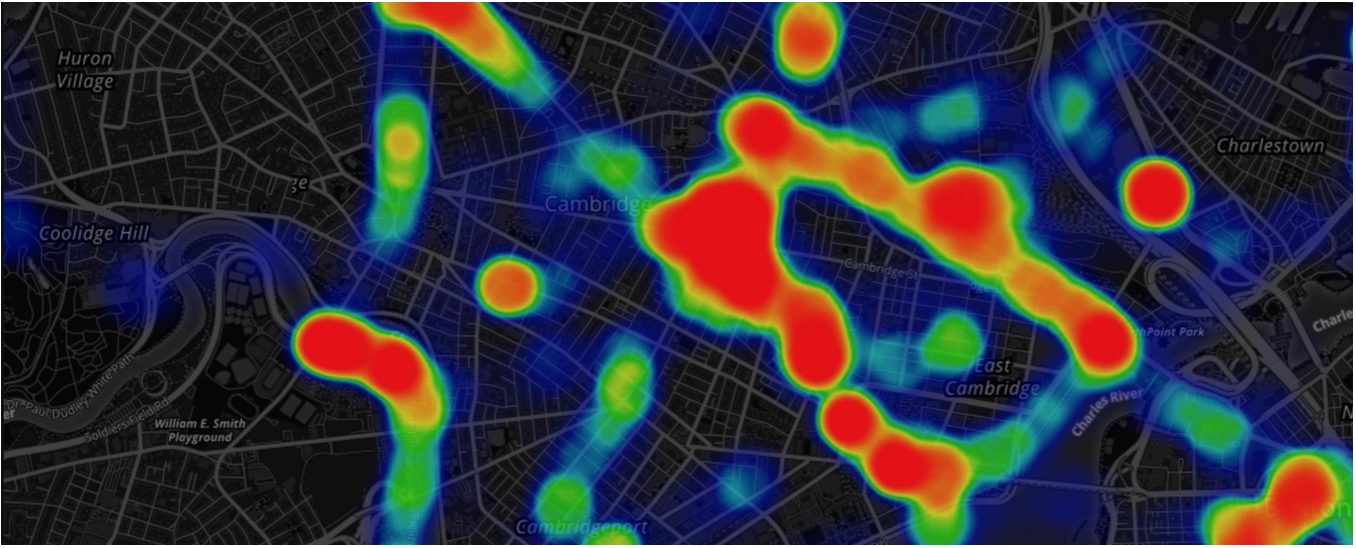
Soundscapes
Overtime, all of the sound readings from an individual form a soundscape based on the average noise levels which shows the typically loud and quiet locations for a citizen in a given geography. In the case of a commute, this information could be used to change a route to work to minimize exposure to noise pollution.
When you have many citizens participating in sensing sound pressure you can form a soundscape of an entire city based on each individual’s exposure to sound throughout his or her day.
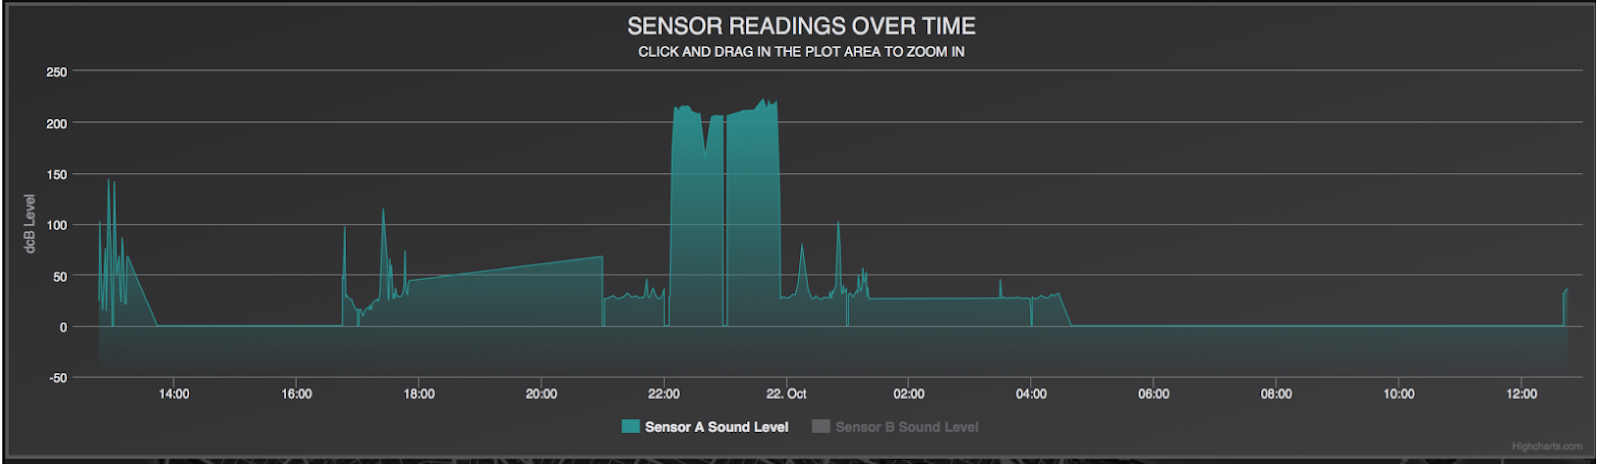
Line Chart
To analyze sound during different parts of a day without considering geolocation, I also charted noise level over time.
While these visualizations were initially developed to explore sound pressure, they can be used as is or modified to explore other types of sensor data.
CONCLUSION
The citizen sensing pilot introduced us to the challenges of collecting sensor data and enabled us to explore several modes of visualizing soundscapes and context rich annotations. The basic modular sensor pack and visualization tools developed during this pilot will be used in future work to help understand how to incorporate sensor data to help inform civic action. Moving forward, we are investigating how to expand environmental sensing through this Citizen Sensing platform. In particular, we will work with the Safecast team and our Media Lab colleagues in the Responsive Environments group to test the integration of soon to be released air quality sensors.