This is a liveblog of Ethan Zuckerman’s keynote at Links 2013. His slides are available online.
Ethan opens by saying that his stock and trade is “the unusual connection.” He starts talking about the Harvard Peabody Museum of Archaeology and Ethnology. The museum hasn’t changed since it’s early collector mentality. The labels actually list the white dude who collected the items rather than their creator. It’s still a colonial approach to museums.
He shows a “rebellib” or “stick chart / shell chart” which is a map from the Marshall Islands with shells representing the islands and curved and diagonal lines representing ocean swells. Since the Marshall Islands are scattered across 500-600km. A Marshall Islander around 1900 is going to be in their boat and traveling between the atolls without seeing them over the horizon. You must travel dozens or more kilometers at a time between them. And when you miss the next atoll you die. And bad things happen evolutionarily if you die on the way to the next atoll. There is a need for inter-island “booty calls” to produce the diversity necessary to sustain a population.
Contemporary scientists have gone back and found that these rebbelib are incredibly accurate. And if you check Google Maps, you realize this is an area of the Earth that we have not sufficiently mapped. Google is a decent proxy for interest in an area since the best resolution is based on demand: people’s willingness to pay for high resolution images without clouds.
Question 1: What unseen forces are most critical to map?
If we were going to make a map of the Earth and we are Marshall Islanders, we don’t just want a map of land spaces and ocean but also of ocean currents. Similarly, what if we were interested flows of information and ideas, or flows of attention. Below the surface of what we are already mapping what else should we be mapping to better understand the world?
Ethan argues there is a tendency to map what’s fixed. National borders are fairly fixed. Roads are fairly fixed. We’ve also mapped things like telegraph lines and steamship paths, which over time have a fixity to them. And now we have the fixed buildings along the Google’s street maps.
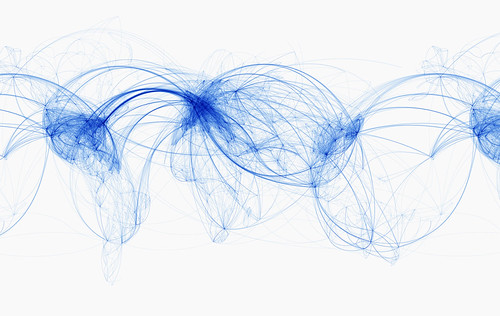
Ethan shows us this beautiful visualization of global air routes by John O’Sullivan. It illustrates the places where is theoretically possible to get to on a commercial flight traveling at least once a week. You get an outline of the continents through the fixed lines.
You can compare the O’Sullivan’s visualization to the animated one created by the Zurich University of Applied Sciences using data from Flightstats.com. They built a model showing the course of every flight over the course of a given weekday. You see a North Atlantic highway grow over the course of the day. But then you start seeing routes that are non-obvious. There is tiny route from Johannesburg to London.
Ethan suggests that there may be something quite different between how we are theoretically connected and the ways that we practically connected. The Zurich University map is shows us the incredible volume of the domestic flights in China, the US and Europe. We the average flight length shorter than 1200km — slightly too far for a train ride — there is an incredible local bias in our movements.
Question 2: How do maps of flow differ from maps of infrastructure?
Infrastructure are the fixed things, where as flows are the actualities that travel across this infrastructure. In the above case, O’Sullivan’s map is a map of infrastructure, and Zurich University’s is one of flow. Ethan argues that some things make more sense as maps of flow. He gives the example of disease, which should be mapped by flow because it is based on the movements of actual patients. The network of how disease moves through humans as vectors connected by hospitals (infrastructure).
Migration is another good thing to map by flow (see peoplemovin). People tend to move based on need rather than along fixed routes. As are the flows of goods; see Leo Bonnani’s Sourcemap of ingredients to common products.

Ethan shows In Transit” from Cabspotting by Amy Belkin, produced with Stamen Design and using data from Yellow Cab. The Yellow Cab company in San Francisco had GPS units in all their cabs, the data from which they released to the artists at Stamen Design. They turned the routes of the cabs into lines in space, illustrating the outline and many streets of downtown San Francisco. But Ethan notes there are interesting blank spots. Hunt’s Point, in particular, is a predominantly African-American neighborhood where cabs “won’t go.” Infrastructure versus flow here is the difference between what’s possible and what’s feasible.
Question 3: Are flow maps inevitably a form of surveillance?
Traffic Maps on Google are based on our own access of their Maps which they use to gauge the number of cars on that road at a time and how fast they are moving. It starts to look like we are being watched when it’s “Ethan Zuckerman at phone number X” looking up map data.
This brings Ethan to the issue of “attention.” He spends a lot of his time looking at the economics and politics of attention, i.e. What do we put our time into? He cites Herbert Simon’s work on the economics of attention. When we think about a surplus of something we need to think about the scarcity of something else. Simon’s example was rabbits. This is a surplus of rabbits only if I have a scarcity of lettuce or shelter for the rabbits. Same thing with attention and information.
Simon was interested in the tech revolution of copying, i.e. Xeroxing. He thought we might have a surplus of information because it’s making a demand on attention, which is not infinitely elastic. We are probably serial monotaskers rather than multitaskers. If we really want to deal with this surplus of information and scarcity of attention, we need to think about how we can filter and aggregate — all of these ideas that have come to be discussed currently (though Simon did 40 years ago).
Ethan says his work focuses on the political ramifications of the attention issue. At the Center for Civic Media, we do things like take all the data from the New York Times and think about how we can map and visualize what they are talking about. These are flow maps. They may be flowing toward one country or topic at any given time in ebbs and flows. Ethan says he’s never seen a map of sub-saharan africa that has deep, sustained attention, except in the case of Liberia.
When you do map it out, U.S. attention via the New York Times it goes toward countries with higher GDP and those with which we are involved militarily in some way. The BBC has a very different pattern. They pay a lot of attention to former empire, which means Latin America is really not paid much attention.
Ethan is interested in the question of what happens to these flows when it’s no longer the editor of the New York Times but a larger group of people getting involved, what happens to these flows?
The Huffington Post with 80 million monthly visitors has a much bigger audience than the New York Times (18 million monthly). But The Huffington Post‘s content focuses predominantly on the U.S. domestic market. They do take an enormous pride in being international, Ethan says, but that content is thin compared to New York Times coverage.
Ethan argues that despite having the ability to hear from anyone around the world, but we might not actually be exposed to those voices.
He cites Kalev Leetaru, et al.’s new article: Mapping the global Twitter heartbeat, which looks at what Twitter users are talking about versus what the news is talking about. The pink and red are showing up in Google News but not in Twitter. Blue is vice-versa. Google News has good coverage of Sub-saharan Africa and India where there is very few people tweeting from those places. These are places and topics that are not making it out via social media channels but are making it out through journalistic channels, showing the continued need for journalism.

Another study Ethan cites is Taneja and Wu, 2013, looking at audiences of the 1000 largest websites (using advertising network data), and asking what two sites does a user read? They find users are more likely to read CNN and ESPN together. In their graph, the US and UK end up in the white cluster, and the Chinese internet is in the red cluster. Japan is the green cluster, and there is a whole lot of clustering between Japanese communities. The Chinese and English internet are very separate from each other, but the authors argue that censorship is not the main factor, rather there is simply little interest in the other’s internet content. Ethan explains that it’s people trying to pay attention to what’s close to home.

In 2010, Paul Butler an intern at Facebook produced a map showing connections across the world. Despite what looks like a very cosmopolitan community, Russia and China are largely missing. Ethan suggests that Russia is more likely to be on Livejournal or VKontakte. Ethan says he’s tried for two years to get the data from Facebook and has failed. He does know though that the mean friend count is 130, with 14% international connections. But this is highly clustered. A few Facebook users have the majority of these international connections. For instance, Cesar looks like a displaced Chilean because of his friend graph and bumps up our international connection numbers in the US.
Ethan argues that we should care about this because spaces like Facebook are taking on the role the New York Times once played. Am I more likely to read about Syria because I see it on the New York Times or because it shows up on my Facebook feed? If I have a friend from Syria, then it’s likely I’m will care more about it. Facebook then would be very useful to actualize that international connection and distribution of news. Thus, we then need to interrogate the Facebook map and find out what the real flow is here.
Question 4: Who, what and where do we pay attention to?
At the Center for Civic Media, we look at 1) what do media sources pay attention to? and 2) what do we as individuals pay attention to? Mapping the Globe by Catherine D’Ignazio is a project along these lines, showing patterns that the Boston Globe was not able to see in their own coverage. For instance, the wealthy suburbs get more coverage per capita: maybe because they are the subscriber base or because that’s where the editors live. The inner areas of Boston are getting less coverage, and for places like Mattapan they are getting biased coverage toward crime and violence. Expand the scope, and we can ask how does the New York Times talk about Ghana versus Germany, and then how does Al Jazeera treat those two countries?
Some of the Center’s questions are like wearing a FitBit. Can I monitor what’s happening to me as a physical being in the world? Can I put myself under surveillance? Nathan Matias and Sarah Szalavitz’s Follow Bias looks at whom you follow on Twitter and breaks it down by gender. Does this change your behavior? Ethan admits that he is much more likely to follow random women who follow him on Twitter versus random men now. But this is not the only thing we could optimize for.
Question 5: If we see flows of attention as unjust, unhelpful or broken, what should we do?
The final thought here for Ethan is: If we can make some of these biases visible, might it empower us to change these institutions or how we interact with these institutions?
— Q&A —
Q: What do you think is the influence of not having good translation online? How about the use of automatic translation?
A: I went to Google to get stats on the use of Google Translation. They were cagey on it. I really want to know how Chrome’s auto-translate gets used. A lot of what I’ve seen on translation behavior is asymmetric. There are very successful online translation communities working hard to go from English to Chinese. Within 18 hours, we see full translations of Game of Thrones episodes. One organization has 50,000 registered translators working on the New York Times and other English news sources, working voluntarily. But if you are in China, you are limited by poor automated tools or these handfuls of online translators (for millions of Chinese users). Now, do English speakers realize there is a desire in both ways for content? Is there? I’m interested in looking at language as a key factor of content distribution. We’ve got them refined for English, Russian, and Portuguese (Media Cloud). What does a view of the world through Globo in Brazil look like compared to a Russians view, etc.?
Q: How do we get our hands on the valuable metadata that we are interested in? Does it have to be through these crowdsourcing projects like OpenStreetMap?
A: That was my third question. How do we look at actual behavior versus potential behavior that’s not surveillance? I think the notion of personal identifiability versus groups is one way to get around it. However, some of these online sites we are looking at need personal identification because that’s what advertising networks need. They need you to be under surveillance. So the next question is, are we willing to put ourselves under surveillance? I’m willing to attach a little FitBit to me to track my steps but I’m not sure I’m willing to let my insurance company have access to that data and have it possibly affect my premiums. Can we start looking at ways that companies have different responsibilities around anonymizing data? Or can I share my own data to build some of those aggregations of data from the bottom up?
Q: What is amplified by certain media? Oil-based painting was key to painters getting famous? Soccer players with television. What are the things that will get amplified? A different type of famous person? (Asked by Cesar)
A: Jimmy Wales has become surprisingly famous. But he does not have much to do with Wikipedia on a day-to-day basis. Rather, he has become an avatar for a community. It’s kind of like a meta-fame. “We’ll make the creator famous because they are famous for enabling things.” This is playing with another bias. The story of Wikipedia is an idea that was compelling enough to spawn a community of editors. The most basic bias in media is that stories have a hero: we celebrate Jimmy Wales because we love Wikipedia. Like in soccer, at the end of the day we celebrate the one guy that shot the goal, despite the rest of the team and all the staff that got them on the field. An interesting question is: Will we see the shift in bias from the individual to the group over the next many years? I think we are developing a respect for the genius in cooperation versus genius of the individual. A good example is in great research papers like the ones that you write, which are enabled by teams of researchers working together.