One of the most energetic sessions at the MIT Knight Civic Media Conference last week was the Civic Media Ignite, which presented thirteen projects by MIT teams and our partners.
(this session was reported with NewsPad, experimental software I’m building for collaborative live-editing of articles. Participation is currently anonymous. The quality in this post may vary.)
Mapping the News (Catherine D’Ignazio)

Ethan Zuckerman presented this session for Catherine, since she just gave birth.
What does media pay attention to? Mapping The News visualizes the connection between the geography of events paid attention to, and the geography of those paying attention. In this visualization of news coverage, we see that Boston Globe focuses on places that are a bit more privileged. Mapping the Globe also shows word clouds based on location, illustrating the differences of coverage received by a place, whether it’s sports, business or violence.
In another project, Catherine D’Ignazio and Luisa Beck visualized International news coverage during the Boston bombings. Using CLAVIN, they were able to geolocate the country of news with 90% accuracy depending on the language used. Aljazeera, surprisingly, pays a lot of attention to Venezuela.
Another of Catherine’s projects, Erase the Border, is a platform for voice petitions that visualizes place for communities split in half by US border protection.
Finally, iSkyTV is a networked art project that detects the user’s location and animates the Google Street View sky above their heads. The project is a reimagining of SkyTV, Yoko Ono’s famed video work from 1966.
Trayvon / Attention Plotter (Erhardt Graeff)

Slides: bit.ly/trayvon-ignite
Erhardt researches full blown media firestorms using Berkman’s MediaCloud software. He’s asking how media attention is apportioned over time? For his study, Erhardt analysed newspapers data, TV transcripts, Google searches, tweets, Change.org signatures
Erhardt is building a tool set for this kind of analysis called Controversy Mapper. http://github.com/erhardt/attention-plotter.
Broad topic: Quantitative analysis of media ecosystems.
Postmarked! (Denise Cheng)
Read here: http://civic.mit.edu/blog/hidenise/postmarked-visualizing-disempowerment.
Where does a postcard sit, inbetween a letter and an online petition?
Spaces are reaction, no zero-sum property, while dormant spaces trap the vitality of areas that surround them.
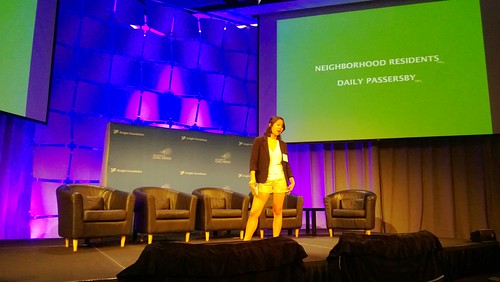
PostMarked focuses on Vale Court, an abandoned building just off Central Square in Cambridge – a building that has been falling into disrepair for ages. Fire alarms go off sometimes, but no one can enter in. Neighborhood residents, passersby are impacted by this building. Postcards filled out by those folk, then sent on to the owners.
Denise created a postcard campaign with multiple inputs to produce one output — postcards that get sent to the owners of the house, encouraging them to sell. She’s working with the local YWCA to collect postcards. No one believed owners would respond, but didn’t matter.
Quotes on Twitter about this talk:
@CivicInsight: We love @hiDenise’s Postmarked – postcards mailed to owners of dilapidated properties to motivate action http://civic.mit.edu/blog/hidenise/postmarked-negotiating-disempowerment… … #civicmedia
!nstant (Ludovic Blecher, Borja Echevarria, Alexandra Garcia and Paula Molina)
This project is from a whole team of Nieman Fellows from Chile, El Pais (Spain), France, WaPo– all of whom took Ethan Zuckerman’s Participatory News class.
News consumers are used to using three kinds of devices: TV, laptops, mobiles. As journalists, we fact check and curate. Legacy media isn’t good at organizing info in a social environment.
With participatory media, it’s sometimes it’s hard to get the big picture. User experience is lacking in live feeds.
Instant! is a mobile app for breaking news that sets out to combine the best of all these platforms. This separates signal from noise and adds context and visuals for live stories.
Their user experience prototype is an example of live reporting the sinking of the Titanic 🙂
They are looking for developers, programmers.They want help and monies!
Quotes from Twitter:
#Niemans speak at #civicmedia Ignite. Chuckles aplenty from their “Titanic tweeted live” example. pic.twitter.com/DxPeN3hu8Q
— Betsy O’Donovan (@ODitor) June 25, 2013
LazyTruth Email (Matt Stempeck)

Cinemagraph of Matt Presenting: http://memories.nokia.com/en/images/d8d9e9ab-379c-48a3-995f-01c2b54d33c2 LazyTruth offers an easy way to respond when presented with possible misinformation. Just forward your email to Ask@LazyTruth.com, and it will be checked against snopes.com, factcheck.com, and many other fact-checking websites.
CoDesign Collaboration with DS4SI (Lori Lobenstine and Kenny Bailey)
This talk was by the Design Studio for Social Intervention, who worked with the CoDesign Studio at the Center for Civic Media this year. Public Kitchen in Upham’s Corner wanted to work with the codesign class in how to build out their initiative: making planning processes public (MPPP). They developed installation that ran for 5 days where people in the neighborhood got to come in and interact with it. The Co-design class built a station where they tested what happens when you accept input vs when you don’t. This allowed the community to realize how giving input makes a difference. Their next project is the Tactical Urban Lab, which sets out to develop temporary interventions to see how it might change the way people feel about their neighborhood. Quotes on Twitter about the talk:
http://t.co/iHzc27ivP9 and #CivicMIT worked together on making public planning meetings more open and accessible #civicmedia — Ethan Zuckerman (@EthanZ) June 25, 2013
Boston Globe Labs (Chris Marstall, Adrienne Debigare)

Globe Labs is part of a group that develops tools at the Globe. The Globe has innovated since the beginning. In WWII they put up a map showing how things were updating on a board on the streets. Globe Labs thinks about the future of the news, specifically the role of technology in the newsroom.
What does collaborating with academia look like? It started with The Center for Civic Media, and now has grown outward throughout MIT and Northeastern University.
They try to create data sets to predict stuff, e.g. the weather (example).
Data set of Tweets shows how the news switched from explosion, to bombing, to manhunt. They have a big screen in their building that shows Instagram feed that they use to inform their stories. In the 68 Blocks project, they embedded themselves in one of the toughest neighborhoods in Boston.
Biggest recent project: responsive design for their web properties.
Fun recent Project: twitter broadcast. Shows every tweet coming out of their newsroom.
Get in touch: GlobeLab
@JenniferBrandel tweets about this session: “The @BostonGlobe’s Globe Lab = rad. Say “may not be able to predict the future, but at least we can show up for the present” #civicmedia”
Changing Gender Bias in the Media (Nathan Matias)
Nathan starts out with the story of Yvonne Brill, a celebrated Rocket scientist that the New York Times introduced as a mother and great cook when she died, instead of a scientist.
What can we do about gender bias in the media, Nathan asks:
1. Take responsibility for our own biases. Nathan shows an app for personal tracking of twitter bias. You get a gender breakdown of the people you follow on Twitter, you can correct the automatic gender score and *reflect* on your biases. Data and experiments make things visible but also sustain long term change.
2. Cooperate, channel people’s anger towards taking constructive action. Nathan shows an example of this with Passing On, a visualization of New York Times gender that directs readers towards improving Wikipedia’s bios of women.
3. Make and Use Tools: Open Gender Tracker is a toolkit for analysis like this dataviz of UK newspaper gender and this analysis of gender in the citizen media site Global Voices.
WAYS OF CONTRIBUTING:
1. Participate followbias.com
2. Partner by emailing Nathan Matias
3. Create
Collaborators
– Sarah Szalavitz (@dearsarah)
– Irene Ros (@ireneros)
– Sophie Diehl
– Adam Hyland (@therealprotonk)
– Lisa Evans (@objectgroup)
Data Murals (Lisa Brukilacchio and kristin DelViscio)
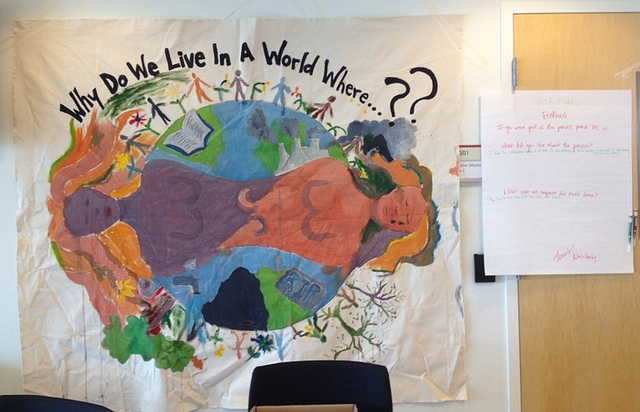
Data Murals is a project to involve community members in interpreting and presenting public information about community health. Fancy images are rarely effective at prompting activism, especially because images are often inaccessible.
Data Murals is developing a toolbox of how to tell data-driven stories through art where visual design tells the data story. People associated with the data create the art, gather and understand the data. Group work takes place to decide what was important and prototype the art.
Data presentation can be boring, but data murals make it fun, engaging, and people care about data. In a way they get people together, and get donors excited.
FIGHT THE BAR CHART!
How can art be part of making data part of daily life?
How can you rethink your data?
Vine Tools for the Newsroom (Joanna Kao)
Joanna is an outgoing editor of MIT’s The Tech and a CS Major. (She’s looking for a job too 😉 (@joannaskao http://vinetoolk.it)
Vine is a mobile app to create 3-6 sec short videos.
Joanna shows examples of vines: Runway model walk, USA TODAY vines.
Works well: Vines are easy to make, and they’re easy to watch, because they’re short. Vines are easily spreadable and friendly to people who cannot commit.
Not so good: interviewer asks a question but no one cares about repeating the video of someone’s answer over and over. Also you cannot edit the Vine.
In journalism the big issue is lack of context. Adding context is even harder.
Her project: Vineyard: An aggregation and annotation platform for Vine. Annotate, embed, caption, aggregate. Search.
CoUrbanize (David Quinn, Karin Brandt)

Karin persents. She’s the CEO of CoUrbanize, which just completed TechStars.
Long weekday planning meetings don’t resonate with people, but pose a threat for the future of our communities. Even in cases of new buildings, you sometimes get a situation where an IKEA building is canceled after 14 years of planning because people finally realized it was happening.
Her goal: make the process more efficient, help developers respond faster to communities’ feedback. Use CoUrbanize to find local projects, local meetings, and stay udpated from one place. Making information accessible will help and Making project data easy to understand.
For example, consider Real Estate. Better planning also reduces cost of delays. CoUrbanize is trying to make urban development open, efficient, and collaborative. Community management platform will inform and engage communities. Need fact-based conversations around all sorts of topics.
CoDesign Collaboration with CCTV (Clodagh Drummey, Susan Fleishmann, Neha Agrawal)

They use vojo.co. Normally to create media, you need a smartphone. But with Vojo, any phone can text in and leave a voicemail with a story of what’s going on. And you can link it to your organization’s website.
The Youmedia program asked people who they voted for and why. They aggregated the stories and showed them on community TV.
Neighbor Media occupied a parking space to ask people about Central Square’s development, “what do you want to see in Central Square?” “what do you love about it?”
For more information, visit cctvcambridge.org
Opened Captions (Dan Schultz)

Opened Captions does Real-time transcript syndication.
Dan created this when he was part of Knight-Mozilla Fellowship. He did a hacky project that modified the text of campaign speeches to make it seem like candidates became more drunk the more boring they were. To do this, Dan realized he needed a transcript of talks. He wanted it in a format anyone can use.
His solution: API that shares data whenever words are spoken on CSPAN.
Follow Dan on Twitter at @slifty