On the Civic Media blog, Matt Stempeck and I have been arguing about the relative importance of learning from failure or success. Matt urges us to be honest about failure and learn from it. I think success is a better teacher. Underlying this debate is a somewhat flawed assumption: that we can know when something is successful.
I am starting a new project with Gaia Marcus of The RSA’s Connected Communities project to create a new, cost-effective way to measure the social impact of public services and civic interventions. We’re designing a mobile and tablet app for recording offline social networks as part of an interview process. I also expect the open source software we build to be useful to journalists and ethnographers.
I’m really excited to work with Gaia, the RSA’s social network expert. In her previous role at Space Makers, Gaia cultivated and measured social networks on the wonderful and successful Brixton Village regeneration project. During my last trip to London, Matt Stempeck and I visited Brixton Village and were impressed with how vibrant and diverse the community has become.
Measuring Human Networks
Typical measures of success focus on counting individuals and their actions in relation to institutions. Evaluators count readers, track the growth of attendees, count incidents, calculate expenses, and give people exams. But it’s rare that these forms of measurement match an organisation’s vision for supporting a community. This becomes a problem when we choose measurable strategies over more creative ideas.
The network perspective offers a distinctive explanatory tool because it reveals patterns of relationship and exclusion that would otherwise remain invisible. [….] The possibility of representing social networks visually also affords a kind of mirror in which individuals can identify themselves and their patterns of social interaction.
Social network data can be tremendously helpful to plan and evaluate community-focused projects. But The RSA Connected Communities project has a broader vision than just improving evaluation of local initiatives and public services. Gaia and her colleagues also want to offer communities a mirror on their own structure, inviting them to discover the potential within their relationships and identify areas which might need growth. I think that can be an incredibly powerful experience.
The networks we want to collect are not limited to networks between people. Gaia has been asking participants to discuss their positive and negative relationship with public services to see what combinations of services are most effective. I can also imagine asking people about their relationship to neighbourhoods, to gather information about the interconnectedness of adjoining communities.
Gaia and I met last month in London to discuss the idea and set out our initial plans. What follows is a record of my thinking and sketches on this project since then.
Data Entry
Collecting data on human social networks is costly and time-consuming. My journalist friend Alex has been charting the history of the Taliban for years, interviewing people throughout Afghanistan, taking notes, and entering them into Tinderbox. At the end of a journey, he brings his notes back to Kandahar and enters relationship networks into his laptop, placing each connection in its historical and geographic context. At the RSA, Gaia and her colleagues have been using “Name Generator” and “Resource Generator” surveys to collect social network information from interviewees. These tedious paper forms must then be typed out by hand before analysis can begin.
Let me illustrate how this typically works by using some fictional personas. Consider, for example, the social network of the fictional character Thorin Oakenshield. A researcher studying dwarves visits the Lonely Mountain one day and asks Thorin about his friends. The researcher wants to find out who Thorin trusts and analyse the broader networks of trust within the Dwarf camp. Due to time constraints and the limitations of paper forms, the researcher is only able to ask Thorin to name five characters, even though Thorin is a great king and surely has a complex network of alliances and friendships. Figure 1 is a diagram of Thorin’s network, illustrated after the survey is complete. Figures 2 and 3 show two possible ways a researcher might collect that data.
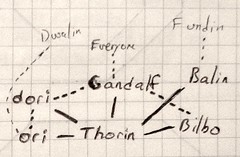
Figure 1: Thorin Oakenshield’s Network
(solid lines are Thorin’s direct friends. Dotted lines indicate friends of friends. Weak fonts for characters such as “Dwalin” indicate possible errors on the Name Generator form)
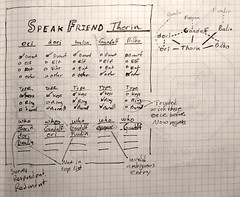
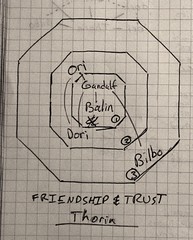
Figure 2: Name Generator Form. Figure 3: Bulls-eye form
The name generator form can take five names, basic information about those five characters, and their relation to the respondent. The respondent can then say who those characters know. Later, a gradstudent or intern can enter all those names into the system and hope they match names at the top.
The bulls-eye form invites respondents to arrange names in respect to how much a respondent trusts that person. A respondent might share passwords with the inner circle, let the middle circle watch for dragons at night, and perhaps share a meal with the outer circle. Lines connect people who know each other. Later that evening, to flickering lamplight in the cave, our researcher tries to pick out genuine relationships among the scribbles and emendations.
Improving on Paper Forms
This paper system has many limitations. It only collects information on a small number of people. Errors and invalid values are easy to enter. Corrections can make the survey form illegible. Thorin’s privacy is at risk, especially if the researcher is kidnapped by wood-elves. Paper surveys require expensive, tedious data entry. Validation and analysis can take months, resulting in outputs which might be useful to the researcher but certainly not to Thorin. On those timescales, there is no opportunity for the community to review the data and correct its limitations.
I think computers can help. Here are some possible interactions:
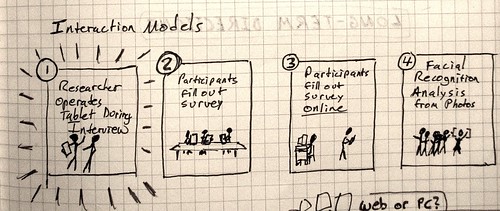
Figure 4: Four possible Interaction Models
I think Gaia has used the first three approaches with basic forms like the name generator in figure 1. For the tablet and mobile app, I think the researcher-led interaction will be the easiest to start with. Perhaps because I’m just now learning qualitative methods, I’m also excited about the possibility of recording researcher and participant conversations on the tablet as they talk about the participant’s relationships. As I blogged recently in my summary of a talk by social network expert Lada Adamic, qualitative research can add important nuance to our quantitative models of social relations.
Sketching out these ideas also brought to mind a further idea. Might we be able to create loose social networks from a combination of people’s personal photographs and face recognition? Could we do that while respecting privacy? Would the resulting network be meaningful or relevant? How might it be skewed? Alas, I won’t be making that software. But I will be working on one to notate relationships, an area I know much better.
Notating Relationships
I have spent the last seven years exploring innovative ways to notate relationships, but I will have to develop new approaches for this project. Most of my previous work has involved an expert user trying to make meaning discover simplicity within complex and ambiguous information. Data entry across multiple respondents may require greater simplicity and restraint.
Should a quantitative survey tool permit participants to express things which the researcher cannot take into account? The Bulls-eye is a great example of the choice to give respondents more flexibility than the task requires. Its advantages are that it matches a popular notion of inner and outer circle friends. However, friendship lines which cross the middle of the bulls-eye can obscure important details. More interestingly, the bulls-eye also naturally invites users to cluster friends into quadrants, a form of relationship which is not recorded.
Should it be allowed nonetheless? Ramesh Srinivasan, who spoke at the Center for Civic Media earlier this year, might argue that different people and communities have unique ontologies for understanding relationships. As a designer-anthropologist, he might favour a blank canvas and a group process to map out relationships. Let us imagine what it would look like if we disallowed grouping friends by quadrant: here is the equivalent of the bulls-eye spread out along a line:

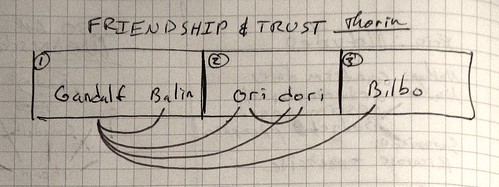
Figure 5: Flattened Bulls-eye
I dislike the flattened bullseye, since it also has unintended implications. A linear list suggests that one is ranking all relationships rather than just placing them in different classes.
Moving away from paper to mobile phones and tablets, we end up with radically different interactions. For example, dragging and drawing are not reliably consistent across mobile devices. In the following straw man proposal, I suggest a two-column selection design based on button presses. The researcher selects a character from the list on the left and selects all of the characters on the right to whom that character is connected.
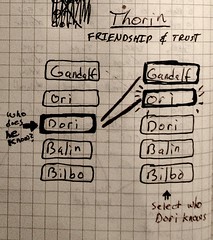
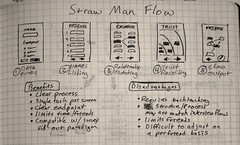
Figure 6: Linking columns Figure 7: Relationship note-taking storyboard
The Design Process
These are only sketches, and this project is perfect for paper prototyping. Before we develop any actual software, I’m planning to hold some Skype-based storyboard and paper prototyping sessions with Gaia, the connected communities team, and a small group of interested social scientists. I’m excited about doing this across an ocean, as it will require technologies which I really love: scissors and glue!
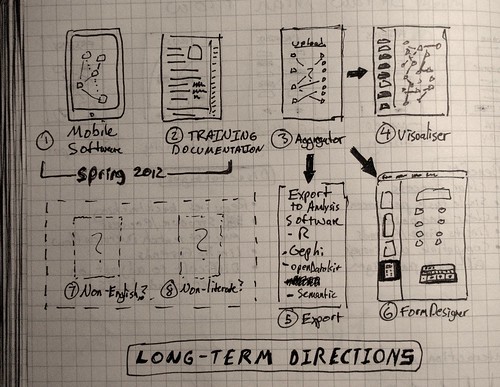
Next Steps
Prototypes will move in the direction of a survey tool for a specific research study. Technology development begins in earnest in January, and I expect a small scale pilot in the spring. I expect it to be internationalised from the start. Once we have smoothed out the worst of the bugs, we will face a tough decision: do we release the prototype to the Web as Open Source, or do we try to apply what we learned to existing standard platforms like eMocha and OpenDataKit? What we do will largely be driven by who wants to use the software, and how easy it would be to integrate with these more established systems. For example, it might become a tool just for social scientists. On the other hand, it might turn into a tool which journalists could use as well. I’m especially keen to make something which is easy for community organisers. Each of these possibilities will shape what the software becomes, so please get in touch if you think you might be able to help!